Multiple Regression Case Study
The following is a sample Multiple Regression Case Study. There are several key elements to a successful regression analysis. The first one is choosing the right functional model. The second one consists of assessing the fulfilment of the regression assumptions.
These two elements go hand to hand and they depend from each other. This is, after choosing a functional model, the assumptions need to be verified and if they are not met, then very possibly we would need to review the structure functional model, or whether a different link-function needs to be used, a ridge-regression needs to be used, etc.
The possibilities are endless, and an expert eye is required. One thing is clear: having a regression model that does not meet the assumptions is as useful as not having any model at all.
A Multiple Linear Model for Life Expectancy
Abstract
A multiple linear regression model is constructed in order to predict Life Expectancy. Five possible predictors were considered and using stepwise regression the final model consisted of only two predictors: Human Development Index and Index of Democratization.
1. Introduction: A theoretical Approach, Argument and Hypotheses
The objective of this paper is to obtain a multiple linear regression model for Life Expectancy, based on the predictors found in the cs2003 comprehensive.sav SPSS dataset. For the purpose of the analysis, the following predictors will be used in a multiple regression model for predicting life expectancy: Human Development Index, Unemployment (% total labor force), Democratization, Hospital Beds per 1000 people, Health Expenditure (% GDP) and Urban Population (% of total).
All of these variables are expected to reasonably affect the average life expectancy of a country and for this reason they are going to be included in the model, or at least, they will be attempted to be included. Then, by a process of model building, the best model containing the above mentioned variables will be constructed, by using the following principles: parsimony, maximum explained variance, and smallest standard error. For the purpose of testing the validity of our model, four cases will be held for testing purposes. The holdout countries will be Marshall Islands, Palau, Micronesia and Samoa
2. Descriptions of Data, Indicators and Slippage
For the purpose of the analysis the SPSS file the cs2003 comprehensive.sav will be used. This file contains 235 variables and 212 cases, corresponding to the countries in the world. The variables included the dataset are many demographic and macroeconomic variables that put together can give a very good idea of the metrics of any given country.
3. Analysis of Findings
The purpose of this section is to fully describe the results of a regression analysis performed in order to address the research question stated in the previous sections. First, the possible linear correlation between the dependent variable (DV) Life Expectancy and the predictors is assessed.
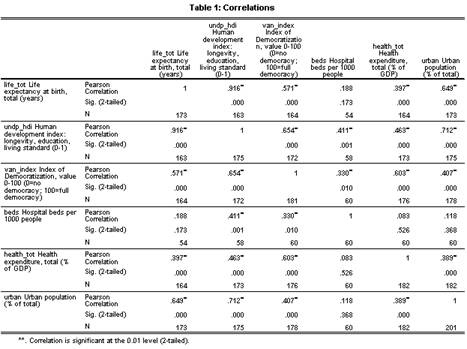
As it can be observed above, all five predictors have a significantly and positive degree of linear association with the DV.
Now graphically:
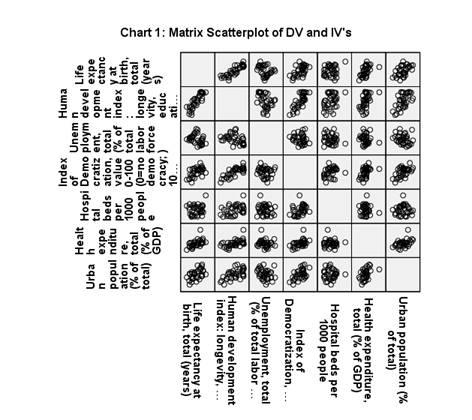
There is a clear degree of linear association between the DV and the potential predictors, which confirms the results obtained in the correlation matrix.
Now that we know that the predictors have a significant linear association with the response variable, a multiple linear regression analysis is performed:
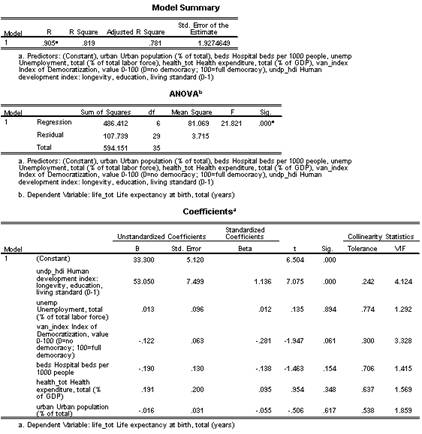
It is observed that the model is significant overall, F(6, 29) = 21.821, p < .001. The model seems to have a good predictive value, since considering that 78.1% of the variation in Life Expectancy is explained by this model. There are no problems with multicollinearity, since all the VIF’s are lower than 5. But we also observe that not all predictors are individually significant. In order to drop the redundant predictors a stepwise regression will be performed.
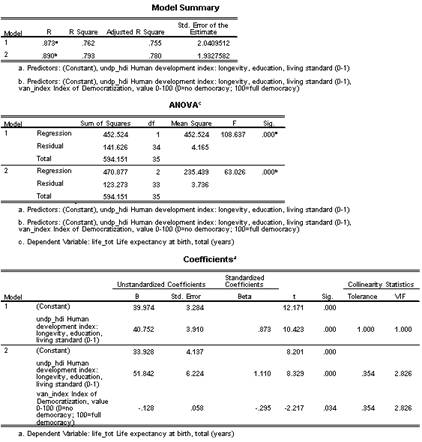
Observe that only 2 variables enter to the final model: Human Development Index and Index of Democratization. Such model explains 78% of the variation in Life Expectancy. The model is:
Life Expectancy = 33.928 + 51.842*Human Development Index -0.128*Index of Democratization
The following residual plots are obtained:
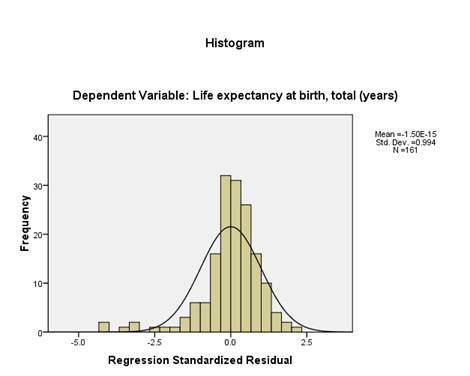
The histogram of residuals doesn’t seem to show any strong violation from normality.
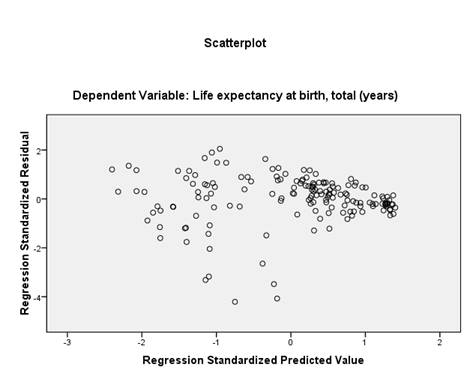
The plot of residuals versus predicted values above doesn’t show any pattern suggesting any kind of problem with heteroskedasticity. The regression assumptions seem to be met.
4. Conclusions and Policy Implications
First of all, it is important to point out that the dataset exhibited a whole lot of missing values, which is something that could be worrisome for the validity of the conclusions of this analysis. In fact, out of 212 cases, only 30 turned out to be valid to perform the regression analysis. It wad found that only 2 variables entered to the final model: Human Development Index and Index of Democratization. Such model explains 78% of the variation in Life Expectancy. The model is:
Life Expectancy = 33.928 + 51.842*Human Development Index -0.128*Index of Democratization
Hence, and increase of 0.1 in the Human Development Index brings and average increase of 0.51842 years in life expectancy, whereas an increase of 1 point in the index of democratization decreases an average of 0.128 years of life expectancy. Overall, the model found seems to be reliable, with a higher percentage of explained variation (78%) and apparently the regression assumptions are met. One possible flaw is that number of valid cases for the regression analysis was quite (low), which could eventually affect the validity of the results.
References
Gravetter, F. & Wallnau L. (2005). Essentials of Statistics for the Behavioral Sciences. Wadsworth.
Mertler, Craig A. & Vannatta Rachel A. (2002). Advanced and Multivariate Statistical Methods. Los Angeles: Pyrczak Publishing.
Kutner, M et al. (2004). Applied Linear Regression Models. New York, McGraw-Hill Irwin.
Appendix
Checking the validity of the model using the holdout data:
The dataset contains a lot of missing values, so the original countries considered for being holdout countries don’t have the required variables to perform the estimate of life expectancy. Hence, we choose 3 countries that contain all valid cases, required to use the regression model obtained:
|
Life Expectancy |
Human development Index |
Index of Democratization |
Predicted Life Expectancy |
Error |
Abs. Error |
%Error |
|
79.1463 |
0.933 |
27.4 |
78.7894 |
0.3569 |
0.356914 |
0.45% |
|
68.8402 |
0.659 |
16.8 |
65.9415 |
2.8987 |
2.898722 |
4.21% |
|
62.4597 |
0.594 |
23.8 |
61.6757 |
0.7840 |
0.783952 |
1.26% |
|
MAPE = |
1.97% |
The mean average percent error is 1.97%, which indicates that the model is valid.
Please e-mail or call us at 1-818-850-7850 for a FREE initial phone consultation and we will be glad to talk to you and see if our expertise can be of help.
Data Analysis
We can do serious data crunching and get meaningful conclusions.
Well Documented
We provide well documented reports, with the exact depth requested by the customer.
Get Results
We build models, we test, we reach conclusions, we get results.
Customizable
We adopt to our customers need. We can customize and automate.
Our Features
Customer Support
We respond quickly to questions from our customers.
Statistical Software
We can handle complex analyses with most of the statistical software packages available
Reports
We offer customized reports.
Free initial Consultation
We will be glad to talk to you about your needs and how we can help
Competitive Prices
We specialize on efficient and affordable solutions for small and medium size business
Call us now!
Did we mention we have a free initial consultation?